Powerorm Debugbar Guide
Displays a debug bar in the browser with information from php. No more var_dump() in your code!
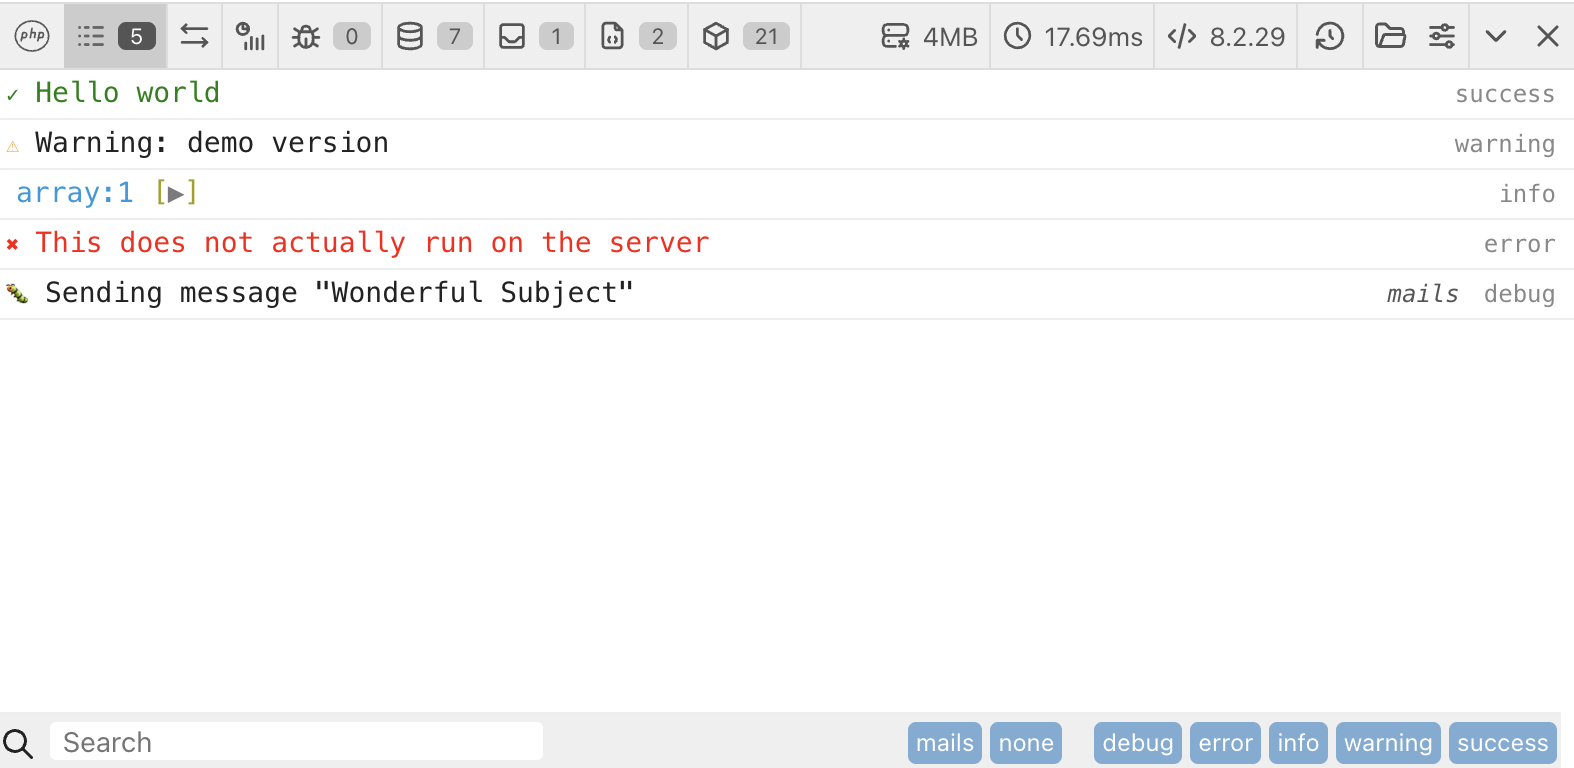
This is just wrapper to the PHP Debug Bar
Installation
Via composer (recommended):
composer require eddmash/powerormdebug
Or add this to the composer.json file:
{
   "require": {
       "eddmash/powerormdebug": "1.1"(check latest version)
   }
}
Setup
To enable the debugbar, add it as component of the orm on the components setting as shown below.
use Eddmash\PowerOrm\BaseOrm;
use Eddmash\PowerOrmDebug\Toolbar;

$config = [
    // ..., other orm settings

    'components' => [
        Toolbar::class,
    ]
];
Usage
DebugBar is very easy to use and you can add it to any of your projects in no time.
- The debugger works by dropping all the static files it requires in the applications
assets directory from where they will be served.
The assets directory is set by calling the
setAssetsDirectorymethod of the debugger as shown in the example below. This give you full control on how to serve this files - You could also use
renderAssetsmethod to display this assets together as shown in the example below. - Lastly to show the debugger invoke the
showmethod.
Note
invoke the show() function at the end of the page so that its able to get all the sql queries performed
<?php

$orm = \Eddmash\PowerOrm\Loader::webRun(\App\Config\Powerorm::asArray());

/**@var $debugger \Eddmash\PowerOrmDebug\Debugger*/
$debugger =$orm->debugger;
$debugger->getDebugBar()["messages"]->addMessage("hello world!");
$debugger->setAssetsDirectory('assets');

?>
<html>
    <head>
            <?= $debugger->renderAssets(); ?>
    </head>
    <body>
        ...
        <?php echo $debugger->show() ?>
    </body>
</html>